One of the most common misconceptions about a vehicle is that the car with the higher horsepower will be the faster car. In my early days as an automotive enthusiast (high school), I too, was very guilty of perpetuating this stereotype. I didn’t understand much about cars back then and because of The Fast and the Furious, all I really knew was that I wanted to put blue underglow on my 1995 F150 so I could be cool too. My friends and I would sit around bench racing different cars based on how much horsepower the internet said they make and in some cases, based on which one had the highest number on the speedometer. Needless to say, my 1995 F150 with a top speedo reading of 85mph always lost, but that is neither here nor there.
As I grew up and started fine tuning my direction in life, I found myself diving deeper and deeper into the world of performance automobiles. With the purchase of a 2008 Mazdaspeed 3 GT, I set myself on a path of learning that hasn’t stopped or even slowed down in the last 7 years. In fact, it eventually led me to a job at Edge Autosport and the desk I now sit at typing this blog.
As I have spent a lot of time listening and learning from people who are far smarter than I, the one biggest thing that I notice is how little most people still understand about dynamometers. Bench racing still continues in parking lots and Facebook pages everywhere, based on peak numbers that someone claims rather than an understanding of the whole power curve.
In this blog, I hope to explain a little bit about what really makes a car fast and help you gain a better understanding of dyno charts.
Peak Numbers vs. Area Under the Curve
The biggest reason this is even a thing is because it is too easy to recite the numbers yours or your friend’s car made. While the numbers can give everyone an idea as to what the car is doing, they can’t tell the whole story. Allow me to illustrate.
Random Facebook poster #1 (RFP1 for short) and Random Facebook Poster #2 (RFP2) both have the same make and model car with similar modifications and are on an open page bench racing their respective cars against each other. RFP1 makes 341hp and RFP2 only makes 335hp. While this isn’t a huge difference, RFP1 and all his buddies are confident that he will be able to pull on RFP2 and then begin to “flame” him mercilessly because he has a slower car and because his tuner clearly sucks and couldn’t get an extra 6 horsepower out of his setup.
On Mexico day, RFP1 and RFP2 are both ready to show each other who is boss. Because he makes more horsepower than RFP2, RFP1 even brought his girlfriend in order to show off his manliness and reinforce why she is with him. However, after the arm drops and the smoke clears, RFP2 is pulling hard on RFP1 in every gear. RFP2 smokes RFP1 easily and RFP1’s girlfriend now rides proudly in the passenger seat of RFP2’s car as they leave RFP1 scratching his head, all alone in Mexico.
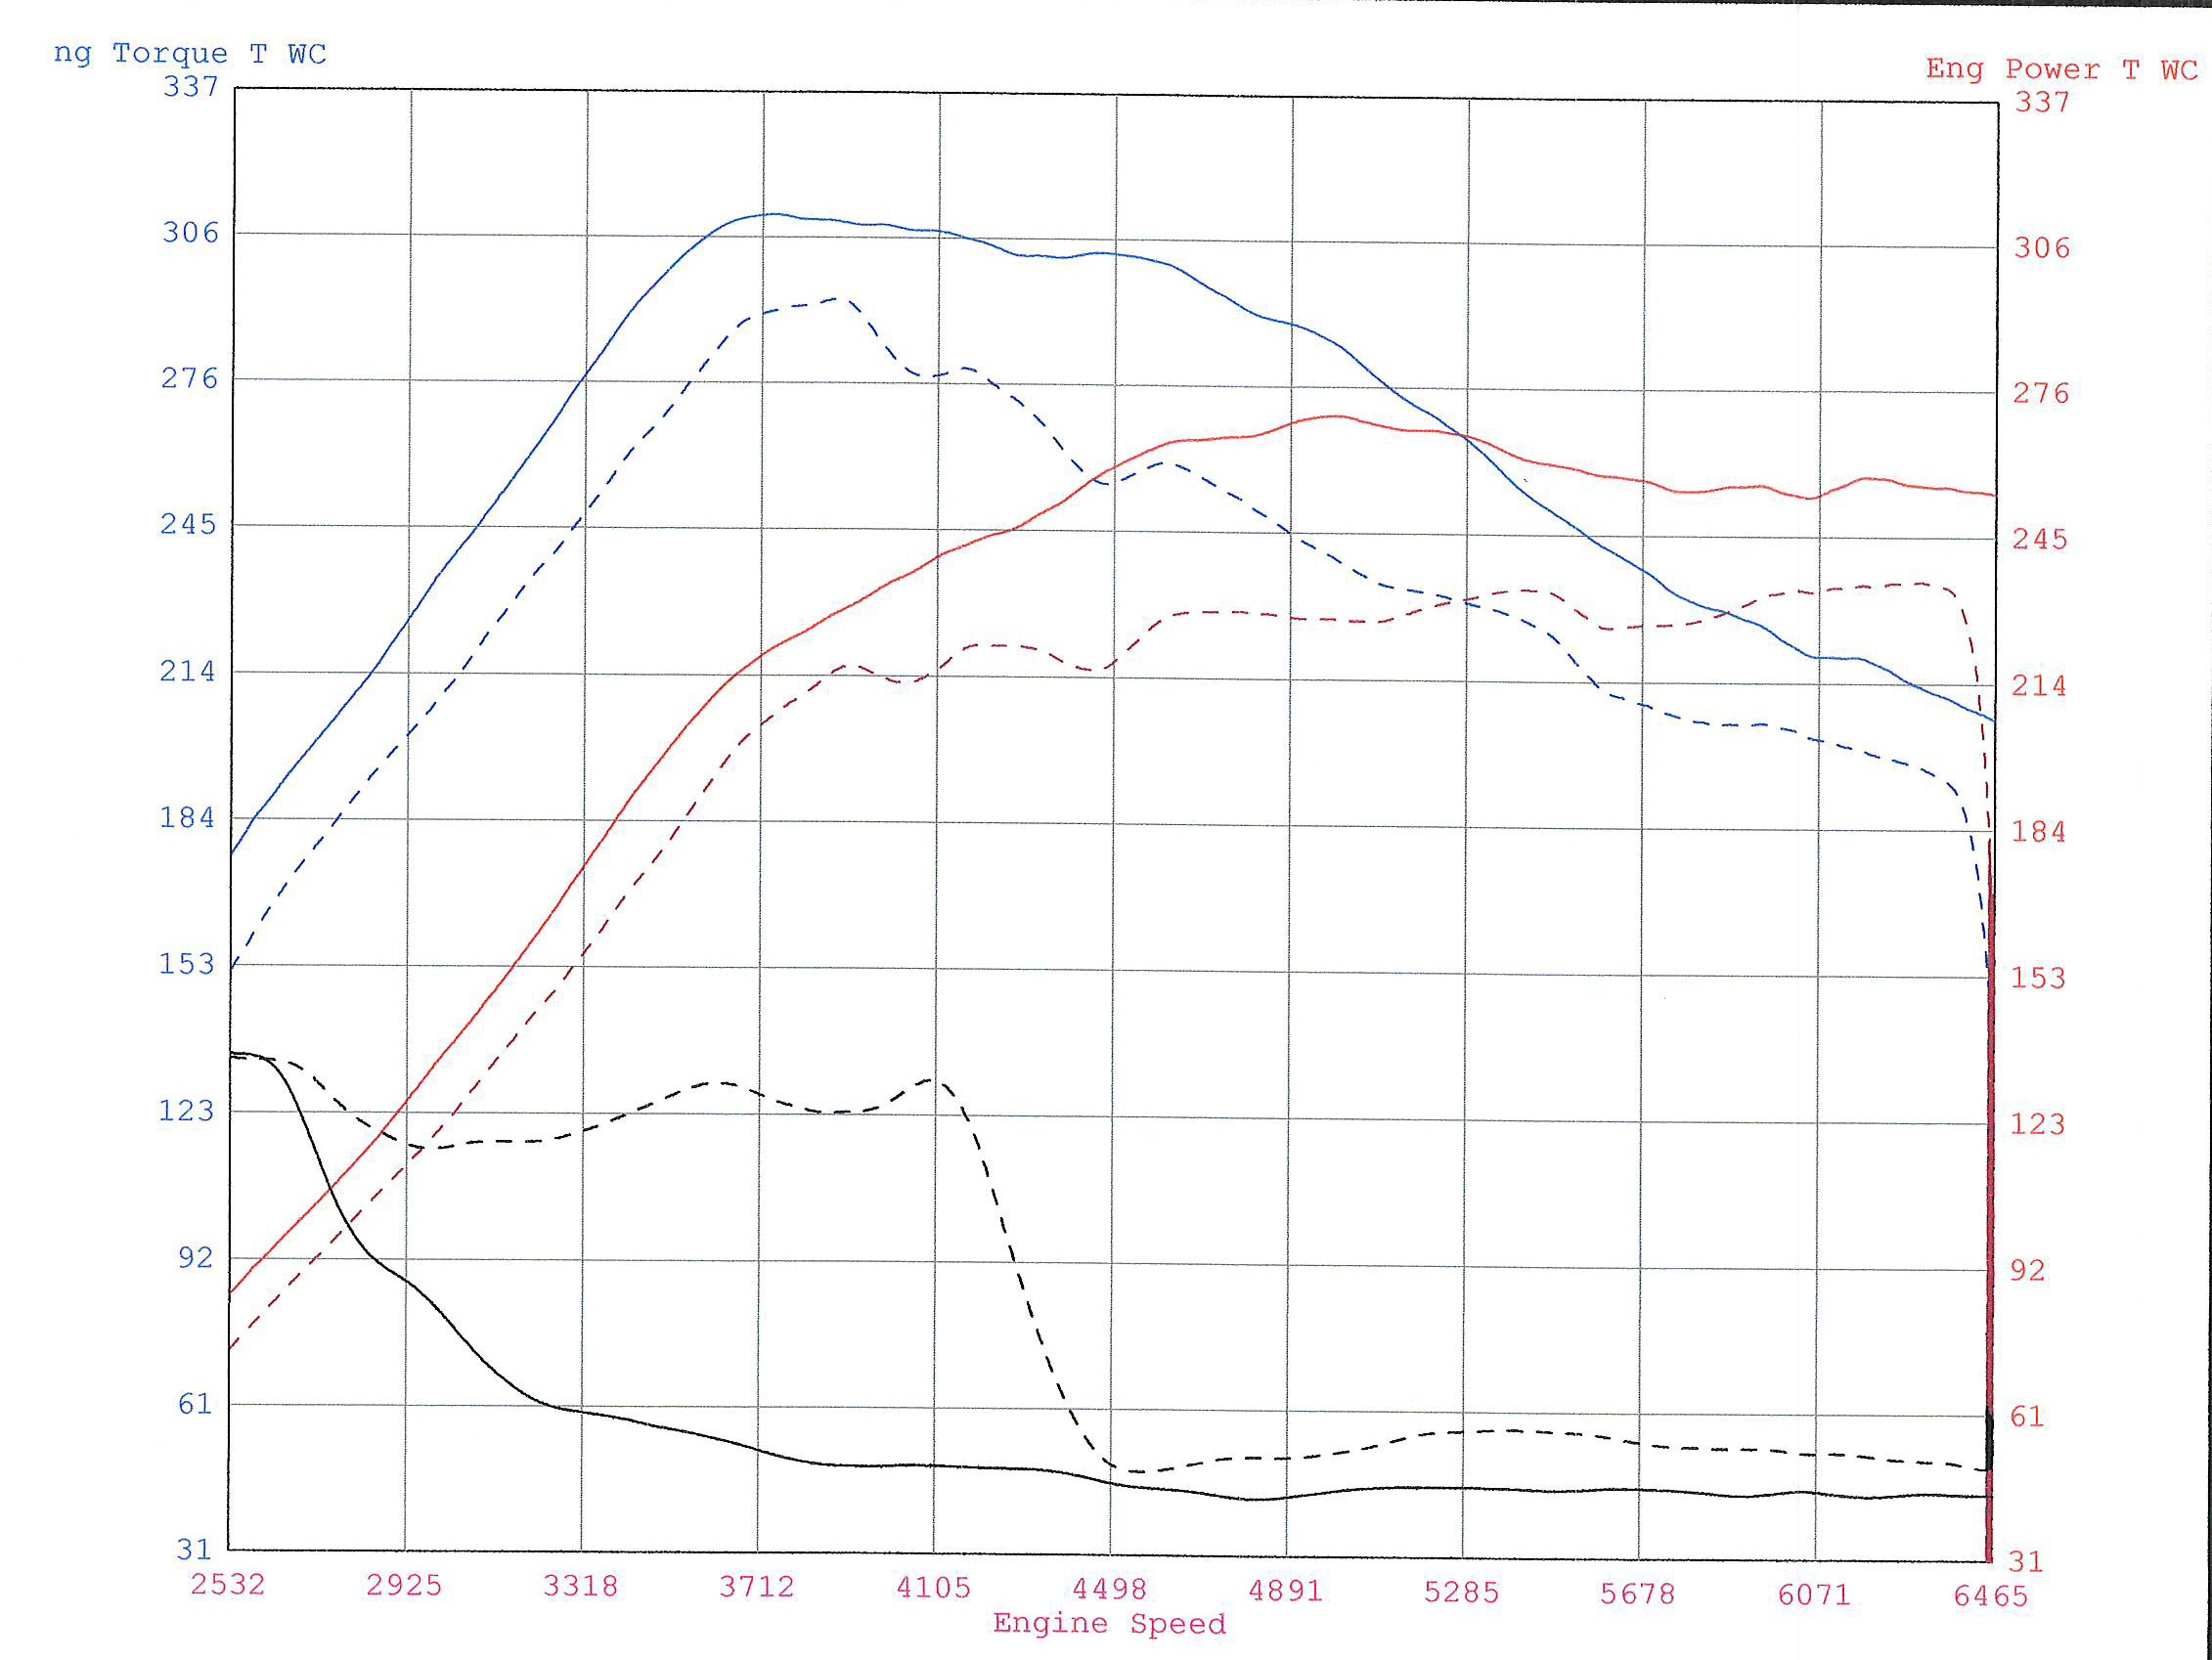
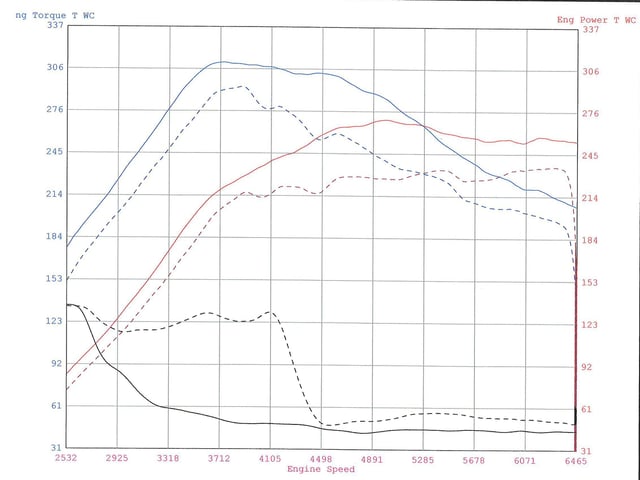
When we look at the dyno plots, it is easy to see why RFP1’s false confidence lost him his pride and his girl. (The dyno is real, the story isn't.)
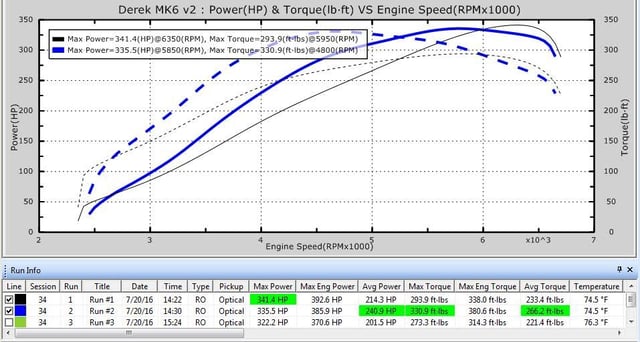
While he does make more power than RFP2, he only does so for a few rpm. What he didn’t know is that RFP2’s setup is being used much more effectively and he has far more power under the curve. When we look at the averages, RFP2 averages 39.4 more horsepower, and 44.8 more torque than RFP1. The race isn’t even fair for RFP1 despite his higher peak horsepower.
Comparing Different Dynos from Different Places
Dyno plots have been fueling bench racer rage for years now. Since the invention of Facebook and the ability to share your plot quickly with people around the world, we’ve seen the Facebook mechanics emerge and shoot down these paper trophies with extreme prejudice because the numbers are not the same as their buddy’s girlfriend’s brother’s friend’s car who has the same mods.
There are many reasons why this is not as big of a deal as most people on Facebook like to make it out to be. The first reason is that no two cars are the same. An engine assembled on Monday or Friday is likely to make less power than an engine assembled on Tuesday through Thursday. This is because Mondays suck for everyone, including engine builders, and everyone is ready to go home on Friday.
While that is an extreme example, it has some basis in truth. As engines are assembled, they have a range of tolerances that are acceptable. If you end up on the looser side of the range, the engine will make slightly less power. If you end up on the tighter side, the engine is likely to make more power. While time and day may not have anything to do with the tolerance in an engine, the tolerance does have a lot to do with how an engine will perform. And this is where you end up running into factory freaks and inversely, factory lemons.
Another reason you can’t really compare like this is that a car will make a different amount of power on different day with different weather related factors considered in. Obviously, a colder day will net more power and a hotter day will net less. This is why dynos use a correction factor. It is to help correlate numbers across a wide range of temperatures, altitudes, and other conditions.
Dyno Correction Factors
Correction factors are based on correction standards which were developed to equalize horsepower readings across a wide range of locations and weather conditions. Up here in Colorado, cars make far less horsepower than they do at sea level and this has to do with significantly lower atmospheric pressure/air density. Altitude is one of the biggest factors that can affect horsepower but some lesser weather related factors include humidity and temperature. All these things effect the amount of oxygen in the air and the amount of oxygen effects the amount of power a car can make all the time. Since this is constantly changing, it is important to have a standard to correct to. This helps keep things consistent no matter where you are or what the conditions are at the time of testing.
The most commonly used correction standard is SAE. The SAE correction factor allows us to compare results on a particular dyno with testing performed on different days.
However, even with powerful formulas designed to standardize results, comparing dyno plots across the country and across different dynos is still not going to get you anywhere. A dyno is a tool used to show you results based on changes you’ve made to ECU mapping and there is a wide variety of dyno manufactures with each one using different technology and calibrations. So there will always be some deviation from the standard.
Since you can’t compare peak numbers, and you can’t really even compare dyno charts taken on different dynos at different times, then what can you compare?
What should you compare?
The answer to that question is simple, percentage gains. Percentage gains and average power are the best way to tell the whole story from a tuning perspective. You went in with a certain amount of power. Whether it is higher or lower than what Facebook thinks you should be making doesn’t matter. All that matters is the percentage gain you came out with and the difference in area under the curve.
For example, we tuned our shop 2013 WRX not too long ago. According to the dyno, it made quite a lot of torque on the stock map, more than we were expecting, and even more than the internet was expecting. But what really matters is the difference in what we started with and what we ended with.
As you can see from the dyno plot, there is a considerably larger amount of power under the curve than when we began, and the average horsepower and torque has increased by 27 hp and 33 tq. That is a percent gain of 14% and 15%, respectively! The car is leaps and bounds quicker now than when we started and much more enjoyable to drive and at the end of the day, it doesn’t matter if the dyno says it makes 50 horsepower or 500. What matters are the gains and the area under the curve from a properly loaded dyno.
At the end of the day, there is only one place where you can truly find out who's car has more power and that's at the drag strip. #etsdontlie
Topics: